
Web domain geolocation and spatial analysis with QGIS
A few weeks ago one of my web archiving colleagues approached me with an interesting question. From a list of Dutch web domains, he wanted to identify the (Dutch) province in which each domain is hosted. He was particularly interested in domains hosted in the province of Friesland. After some experimentation I was able to answer this question using a two-step procedure:
- Geo-locate the web domains using a custom Python script.
- Combine the results of the geolocation exercise with openly available geographical data using QGIS, an open-source geographical information system (GIS).
Even though the outcome of the analysis is not particularly interesting, I imagine both the geolocation methodology and the GIS analysis steps might be useful to others. So, this blog post is primarily intended as a tutorial that gives a walkthrough of the steps I followed.
Web domain geolocation
In Python, the GeoIP2 module can be used to get geolocation data (latitude, longitude, but also country and city names) for any IP address. IP addresses can be queried through either a web service, or using a local database. I went for the local database option, which requires you to download an up-to-date version of the GeoLite2 City database, which can downloaded from the MaxMind developer site. To download the database you first need to create an account (which is free). Note that this database is widely used; for example, the British Library used it for geo-locating their 2014 domain crawl1.
IP lookup
Since the GeoIP2 module expects IP addresses as input, we first need to establish the IP address that is associated with each web domain in our list. In theory it should be possible to do IP lookups natively in Python (e.g. see here). However, after running into various problems, I ultimately wrote a simple wrapper function around the Unix host command. Unfortunately this does mean the script will only run in Unix/Linux environments.
Geolocation script
The complete geolocation script is available here. It takes three command-line arguments:
- An input file. This is a text file, with each line containing one web domain. It has the following format (note that these are not valid URLs because they don’t include a leading scheme/protocol component):
kruisbandkliniek.nl anima-communicatie.nl nieuwebrabander.nl isisschuurman.nl wamail.nl kopenzonderklussen.nl muziekles-laren.nl - An output file.
- The location of the database file.
The output file is a comma-delimited text file. For each domain, it reports:
- A Boolean flag that indicates whether the domain can be mapped to an IP address.
- A country ISO code (if available).
- A city name (if available).
- Latitude and longitude (if available).
QGIS
After I ran the script on the list of Dutch domain names, I noticed that city name values were often missing. However, latitude and longitude were always available (provided that a domain can be mapped to an IP address), so that’s what we’ll work with here. In order to answer the question that started this whole exercise (“which domains are hosted in the province of Friesland”), we need to do some additional spatial analysis. Geographic Information Systems (GIS) are a class of software that are specifically suited to this. So, I downloaded and installed the free and open-source QGIS software.
A general discussion of QGIS is beyond the scope of this blog post; however the Programming Historian website has a good introduction to QGIS2. For the analyses covered in this blog post I used QGIS 2.8.6 (which is the slightly outdated version that is in the default Ubuntu software repositories).
Visualise the point data
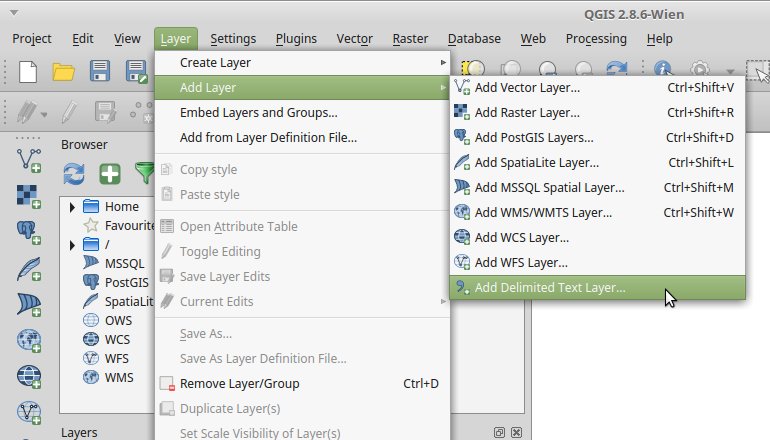
As a first step, let’s visualise the output of the geolocation script. Launch QGIS, then from the Layer menu select Add Layer / Add Delimited Text Layer …:
This opens up a dialog window where you can select the output file of the geolocation script. There are also some options you can set here, but in this case you can stick to the default values:
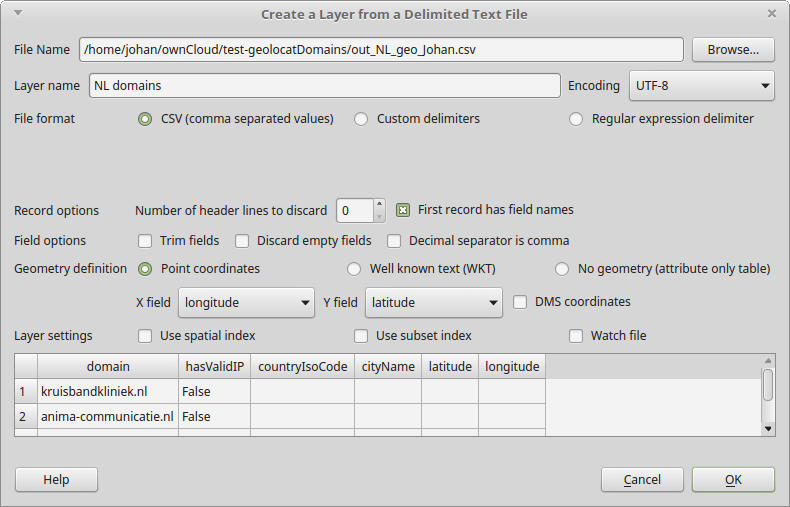
Under Geometry definition you can select the columns with the X- and Y-co-ordinates. As it turns out, QGIS is clever enough to figure these out by itself from the column headings in the file. Click OK to start importing the file. Note that if any records in the file don’t contain latitude/longitude values, you will see an error message like this:
Errors in file /home/johan/test-geolocatDomains/out_NL_geo_Johan.csv
594 records discarded due to missing geometry definitions
It is safe to ignore this, as any remaining records are imported correctly. After closing the error message, you need to specify the coordinate reference system in the following dialog3:
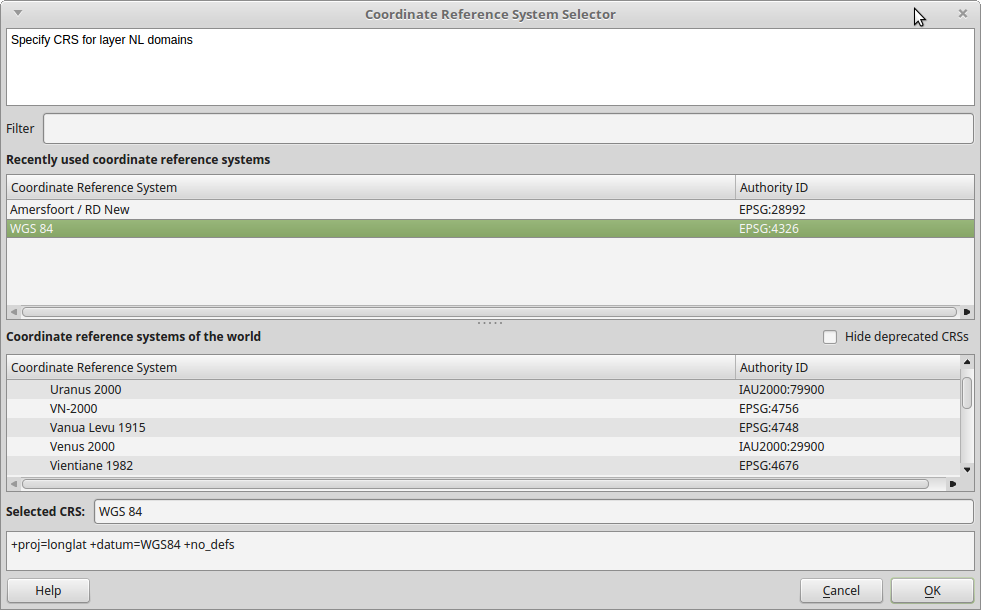
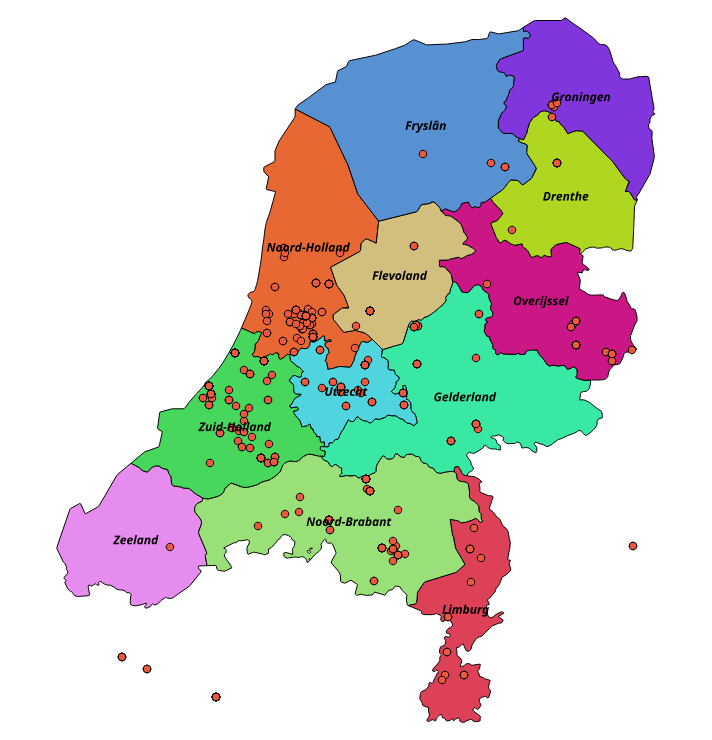
Since the point data file uses geographic coordinates (latitude/longitude pairs), select WGS 84 (which is also the default) and press OK. If all goes well you will now see the imported points:
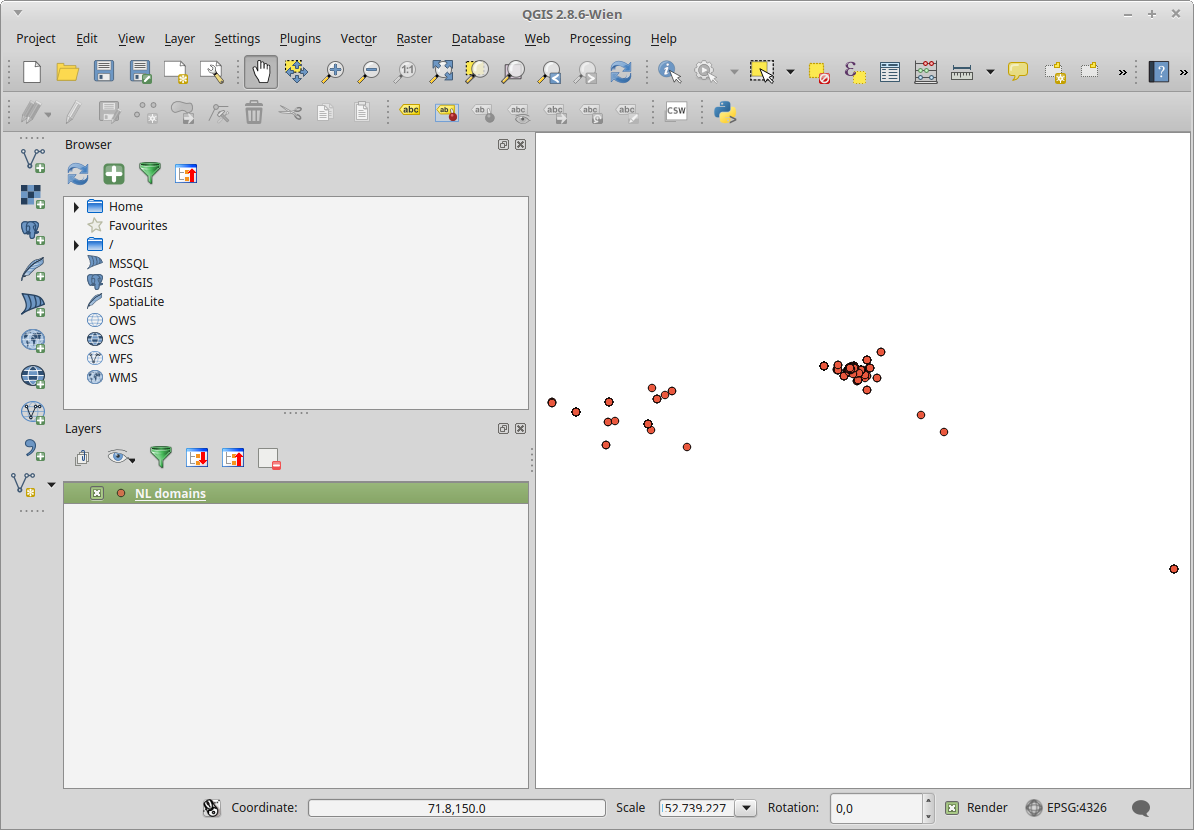
Note that you can zoom in to parts of the map view for a more detailed look. Before going any further, this is a good moment to save our QGIS project; to do so open the Project menu on the left, select Save, type a file name and the click on the Save button. Done!
Add a provinces layer
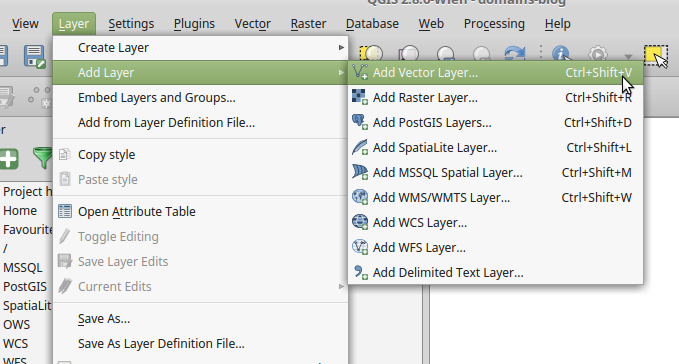
The objective of this exercise was to link web domains to provinces. A free, generalised vector layer of Dutch province boundaries is available here in a number of formats. I downloaded the GeoPackage version (which is essentially an SQLite database). After unzipping the file, go to the Layers menu and select Add Vector Layer ….:
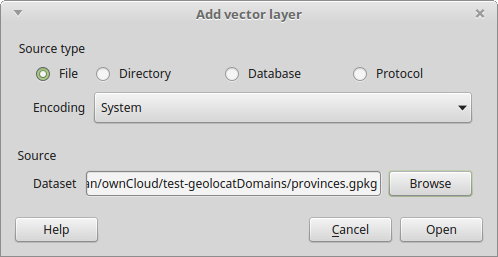
Then open the downloaded GeoPackage4 file in the dialog that appears:
After opening the file, the map view looks like this:
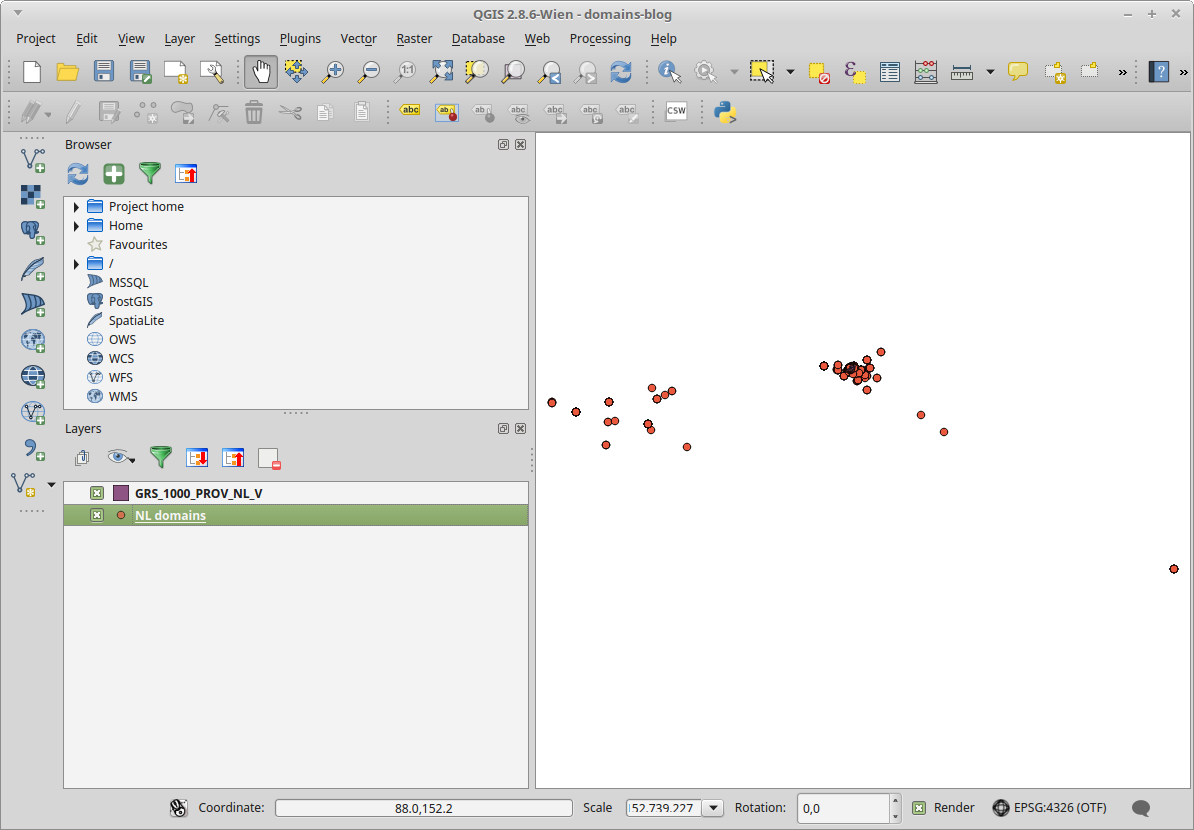
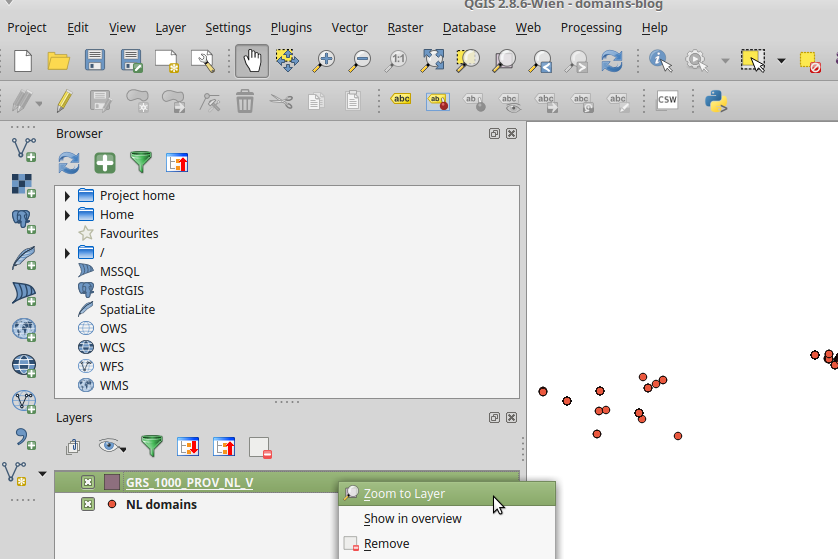
Note that the provinces layer is visible as a tiny purple blob at the center of the image! The reason for this is that the default zoom level of the map view covers the whole geographical extent of the domain points data, which apparently includes locations all over the world! So let’s change that. In the Layers panel, hover over the provinces layer, right-click and then select Zoom to Layer:
Result:
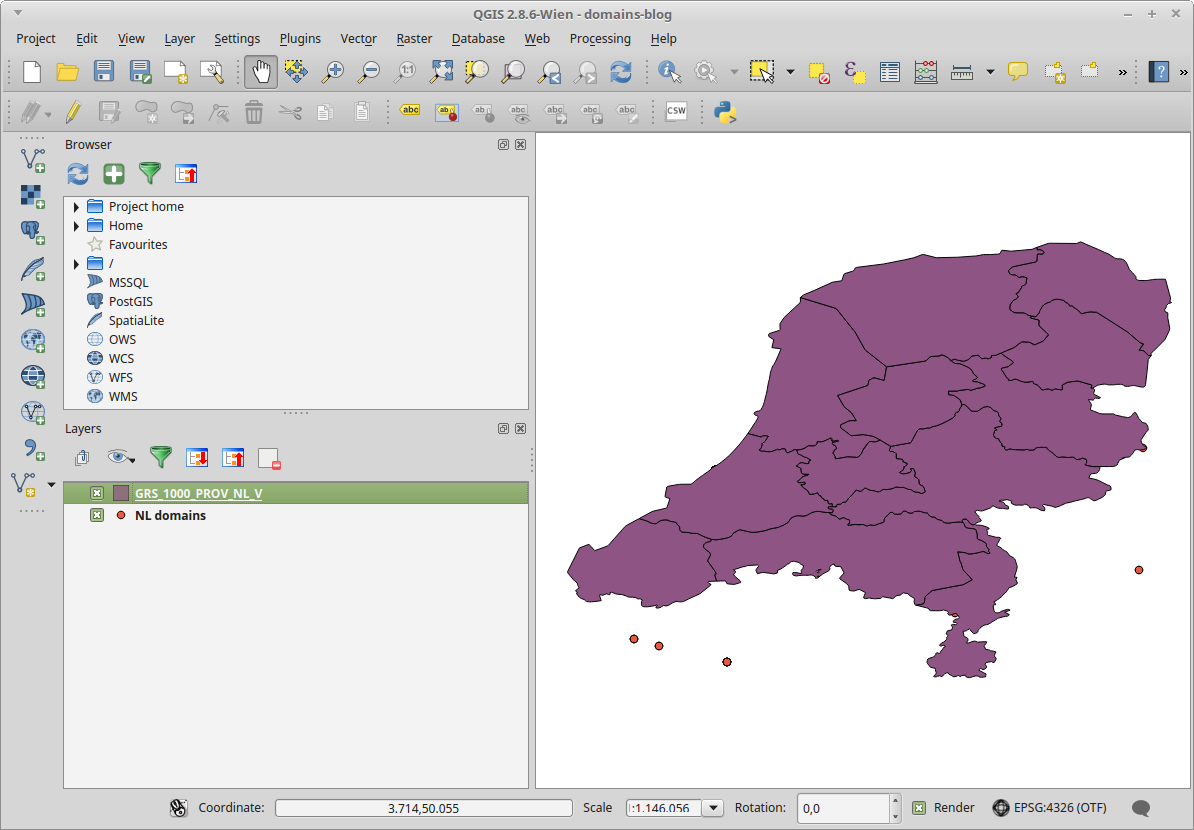
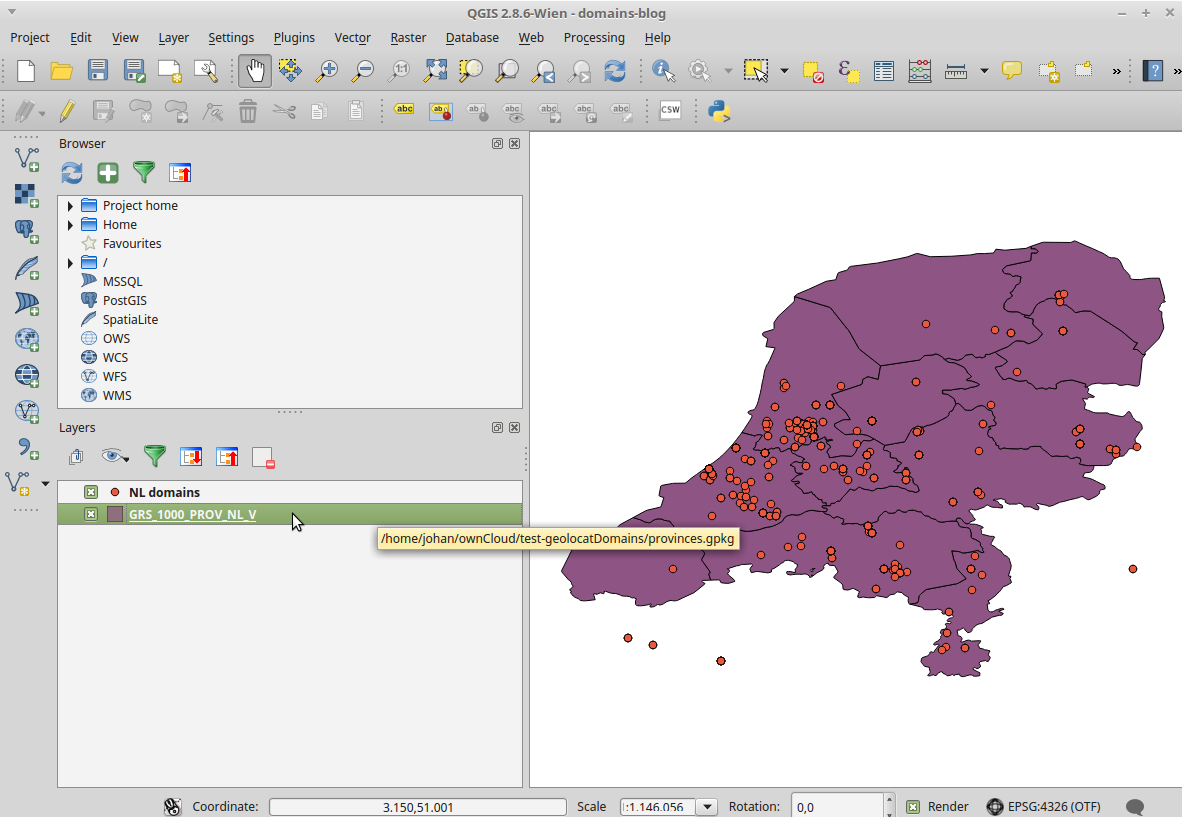
As you see, provinces layer now obscures the point data. You can fix this by dragging the provinces layer to the bottom in the Layers panel:
Customise appearance of provinces layer
Now let’s improve the appearance of the provinces layer. In the Layers panel, hover over the provinces layer, right-click and then select Properties:

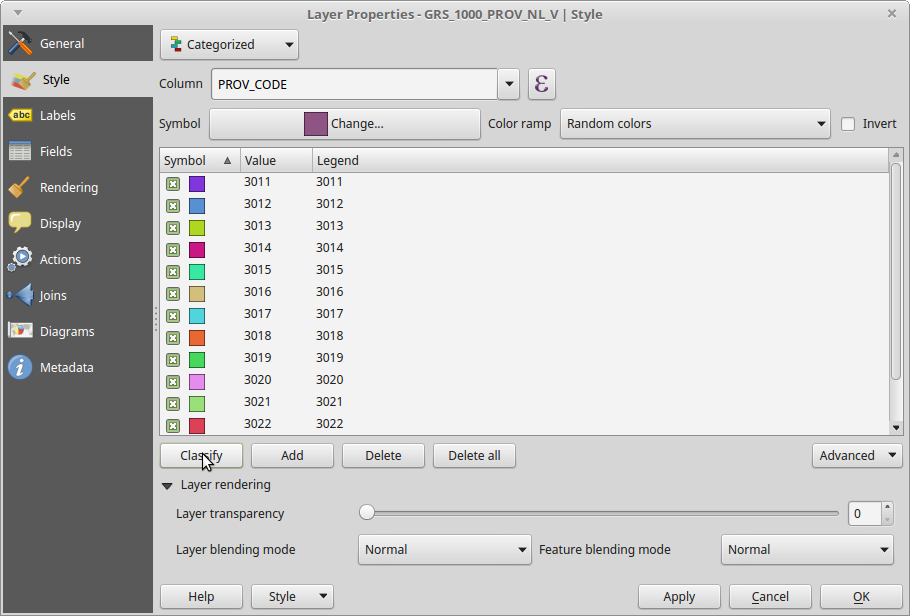
In the dialog that appears, first click on Style in the left pane. Click on Single Symbol in the drop-down menu, change it to Categorized, and then click on the Apply button:
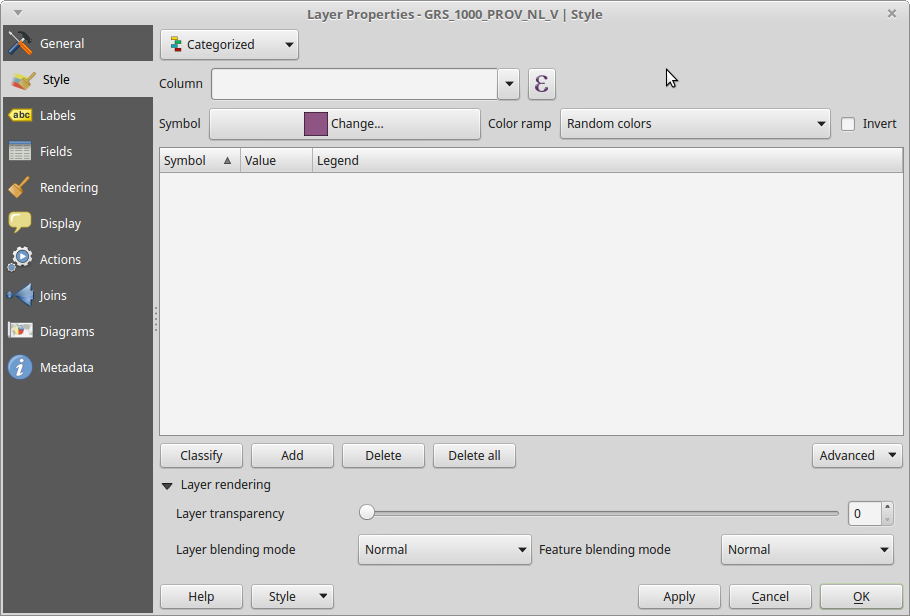
Now click on the Column drop-down menu, and select the column (attribute/field) that represents the map classes. In this case I used the PROV_CODE column. Next, click on the Classify button, which automatically assigns colours and legend values:
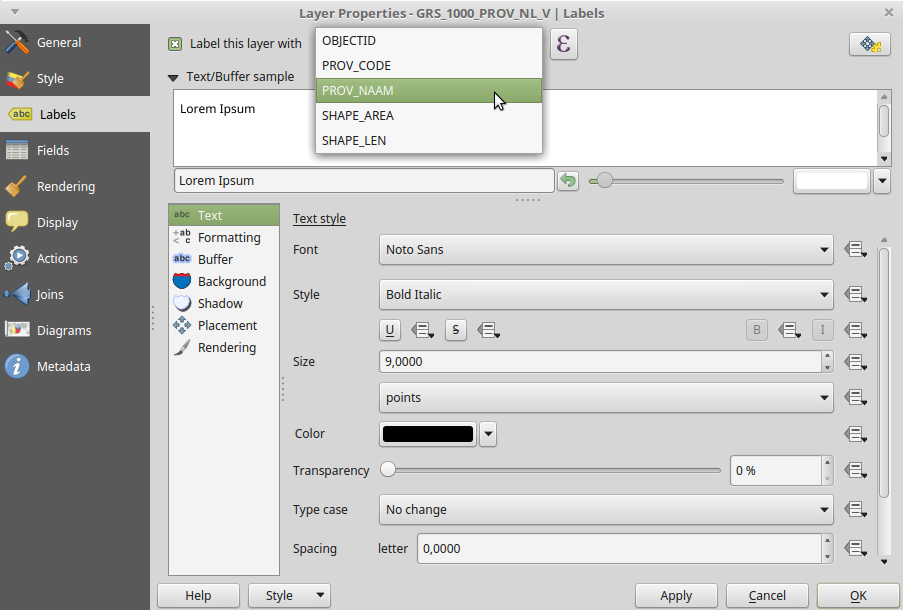
Let’s also add some labels. Click on Labels in the left pane, and tick the Label this layer with checkbox. Use the drop-down menu to select the column (attribute/field) that is used to assign the labels. In my case I used the PROV_NAAM (“province name”) column:
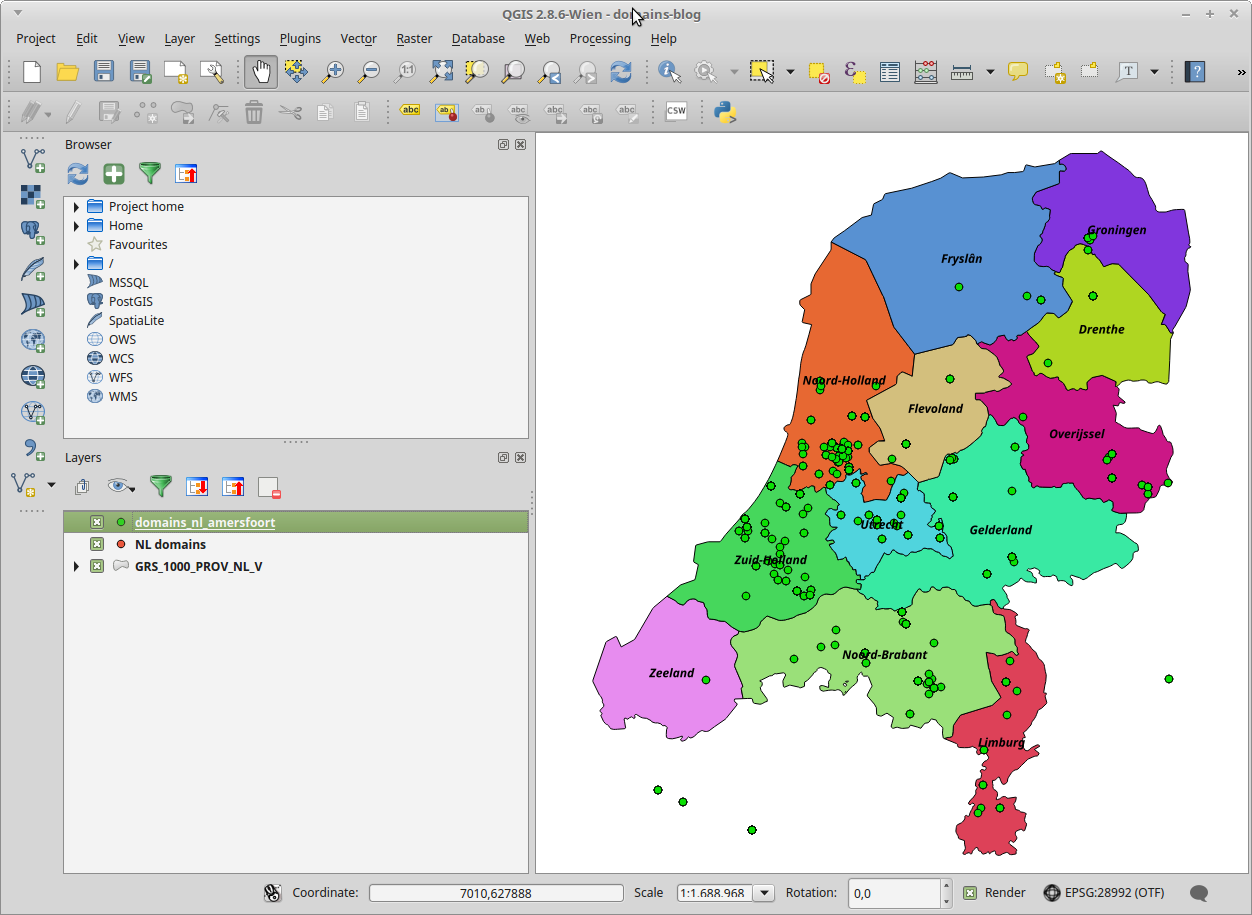
Click on the Apply button again, and then on OK. Our map view now looks like this:
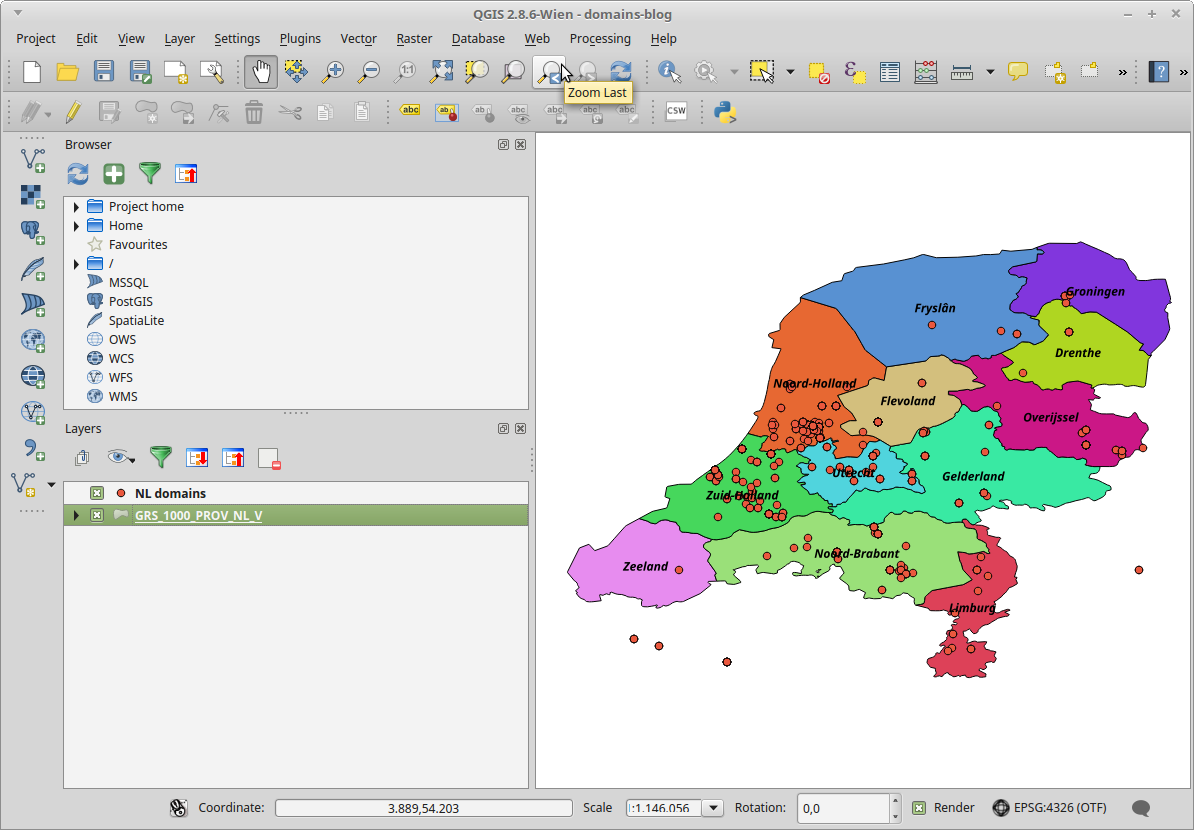
Which is pretty decent! You can use the Save as Image … item in the Project menu to export the map layout into a variety of image formats.
Spatial analysis
Having a pretty-looking map is nice, but in order to know which domains are hosted in which provinces we need to do some actual analysis. More specifically, for each web domain (point) we need to extract the corresponding attributes from the provinces vector layer. This is one of the most basic functionalities of QGIS. However, most of the analysis tools of QGIS require that all input layers have the same coordinate reference system. This is not the case here: the geographical coordinates of our point data are defined as latitude/longitude pairs, whereas the provinces vector layer uses the Amersfoort / RD New coordinate system (which is commonly used for maps of the Netherlands)!
Transform point data to coordinate system of provinces layer
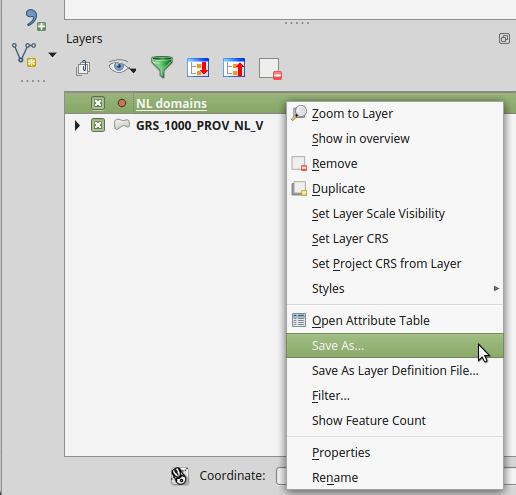
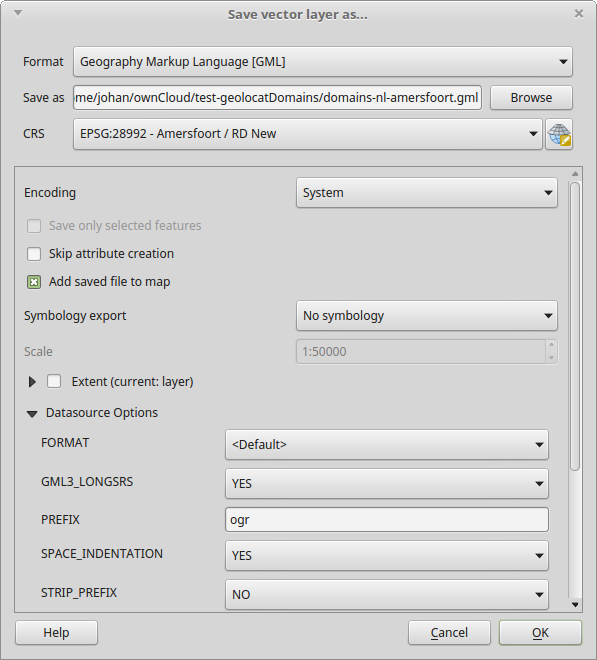
So, before we go any further we first need to transform our point data to the province layer’s coordinate system5. In the Layers panel, hover over the points layer and right-click Save As …:
Set Format to Geography Markup Language [GML] and specify a file name and location. In the CRS dropdown menu, select the coordinate system of the provinces layer (here: Amersfoort / RD New). Leave all other options to their default values:
After pressing OK the new layer is automatically added to the map view.
While at it, let’s also change the project coordinate system to Amersfoort / RD New6: in the Project menu, click on Project Properties …. In the dialog that now appears, click on Amersfoort / RD New in the Recently used coordinate reference systems pane, and then press Apply:
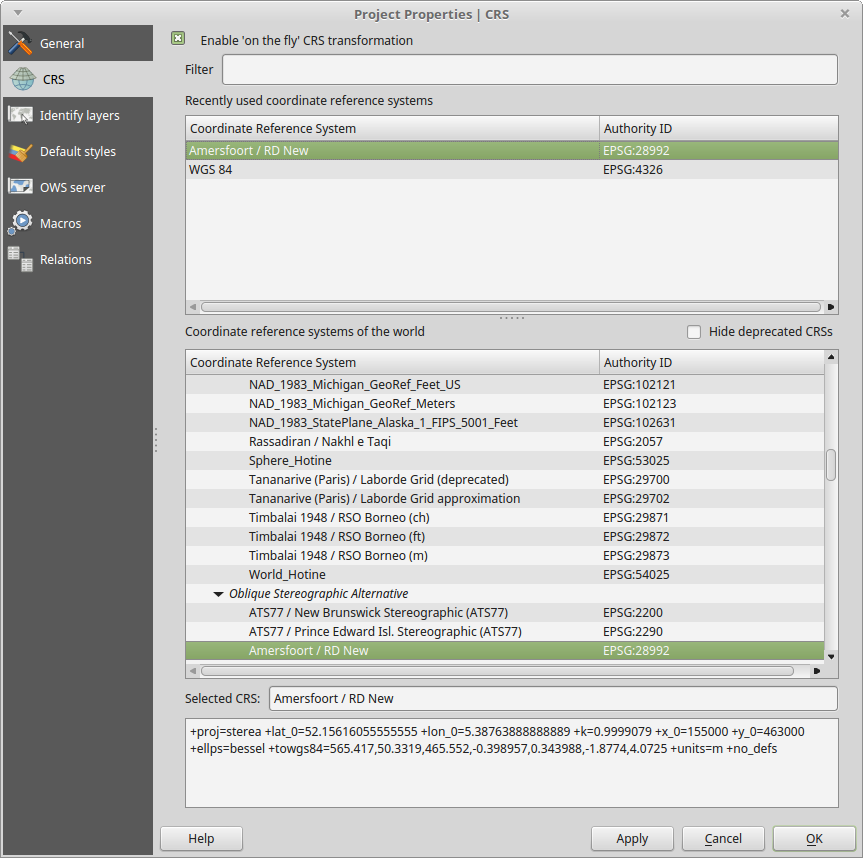
Now press OK, and you should view something like this:
Join attributes of point and province layers
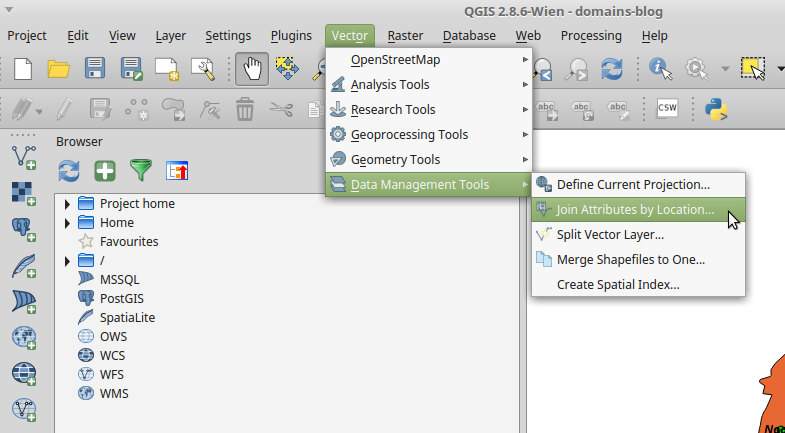
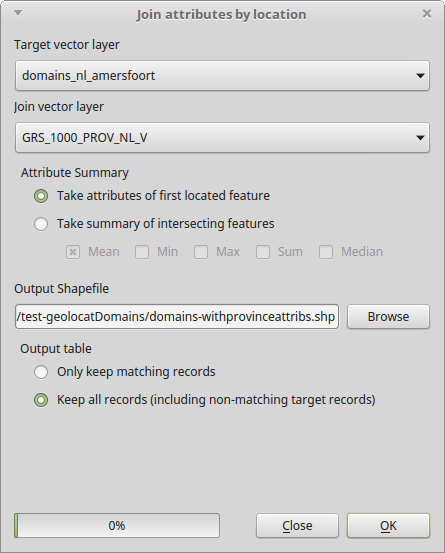
We’re now ready to combine the attributes of the point and vector layers. From the Vector menu, select Data Management Tools, and then Join Attributes by Location …:
Next, set the Target vector layer to the layer with the (transformed) point data, and the Join vector layer to the provinces vector layer. Leave Attribute Summary to its default value (Take attributes of first located feature), specify an output file and set the Output table setting to Keep all records:
Now press OK. After a while this dialog pops up:
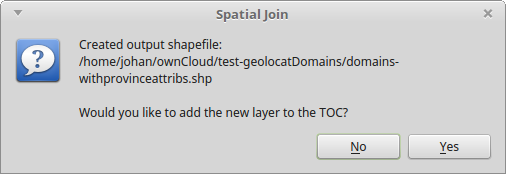
Click Yes, and then close the Join Attributes dialog window.
Export to text file
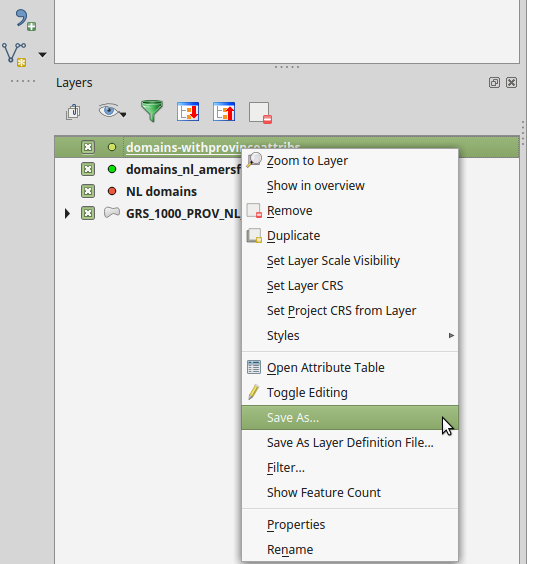
As a final step we export the layer that we created in the previous step to a delimited text file. In the Layers panel, hover over the new layer and right-click Save As …:
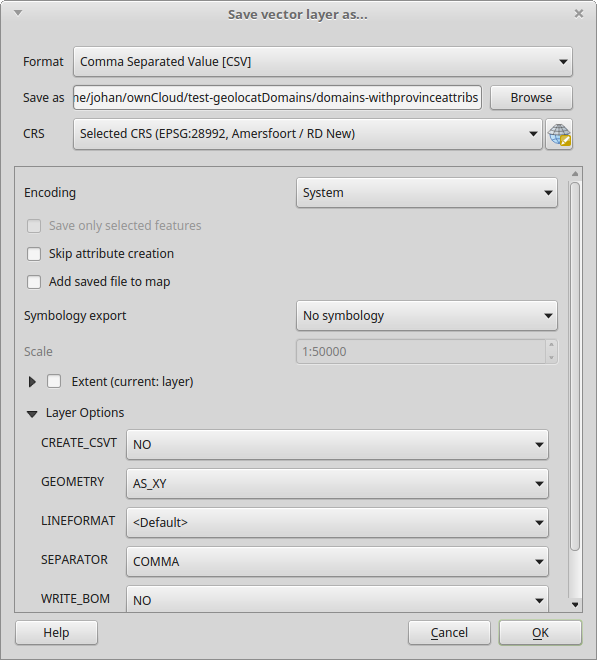
In the dialog that now pops up, set Format to Comma Separated Value, specify a file name and press OK:
You can now import the resulting text file in your favourite spreadsheet application. Here’s what it looks like in LibreOffice Calc:
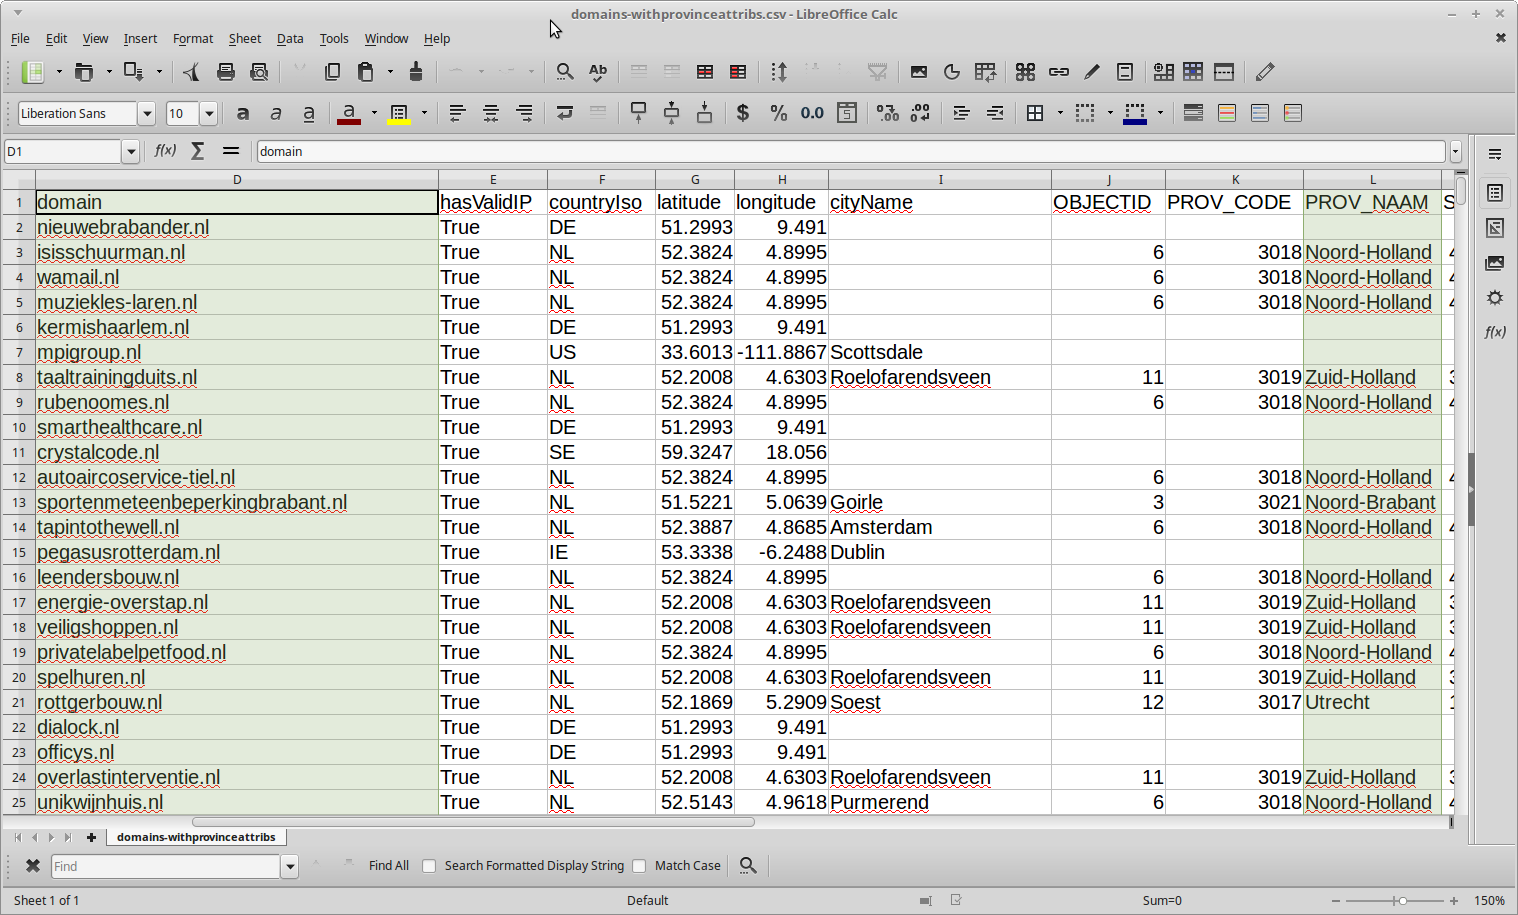
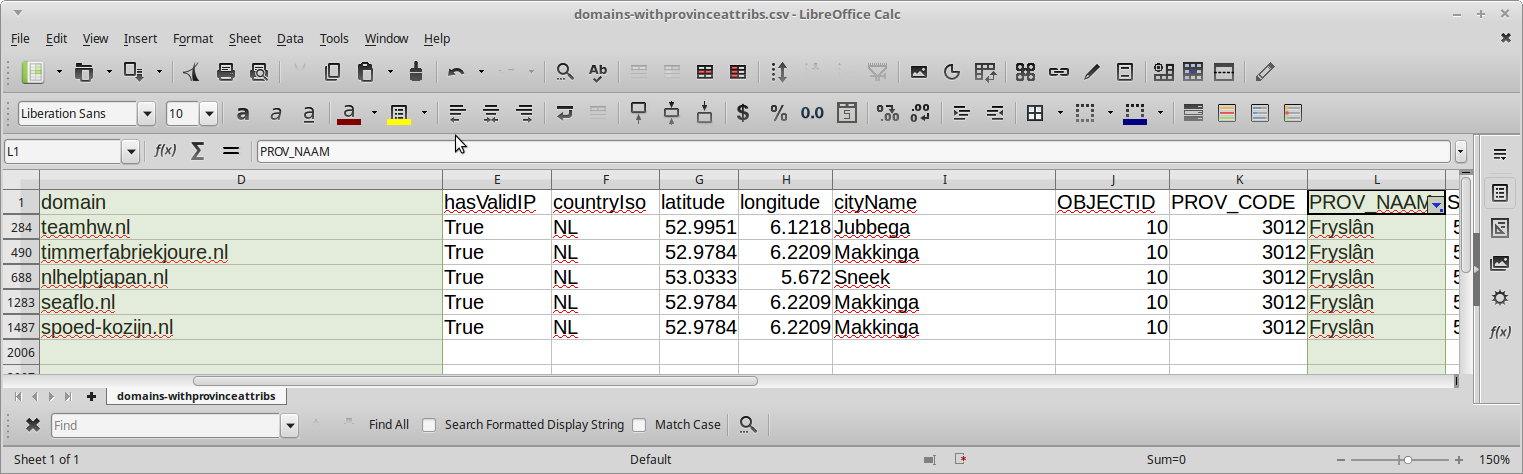
As you can see here, each domain record now contains a column with the corresponding province name (and some additional province-specific columns), and from this we can easily identify the domains that are hosted in Friesland (or any other province):
Final thoughts
As I’m originally a geographer by training, this was a nice opportunity to go back back to my roots a bit and muck around with geographical data. The last time I did any serious work with geographic information systems was around 2007; back then even simple analyses like this one needed expensive proprietary software. I hadn’t used QGIS before, and even though I’ve only scratched the surface here it looks like a really useful addition to the toolbox of anyone working with geodata.
Further resources
-
Geo-location in the 2014 UK Domain Crawl: https://blogs.bl.uk/webarchive/2015/07/geo-location-in-the-2014-uk-domain-crawl.html ↩
-
Note that this is based on a pretty old version of QGIS, so some things may have changed since then. ↩
-
A good introduction to coordinate reference systems can be found here: https://docs.qgis.org/3.4/en/docs/gentle_gis_introduction/coordinate_reference_systems.html ↩
-
The other formats will most likely work fine as well, but I just selected GeoPackage, as unlike the Shapefile format it’s an open standard. ↩
-
Or the other way round. ↩
-
This step is not necessary for the analysis, but I just did this because I don’t really like the way the map view looks in the WGS 84 coordinate system. ↩
-
web-archiving
- How to preserve your personal Twitter archive
- Mapping the Dutch web domain
- Restoring Liesbet's Virtual Home, a digital treasure from the early Dutch web
- Web domain geolocation and spatial analysis with QGIS
- Crawling offline web content: the NL-menu case
- Resurrecting the first Dutch web index: NL-menu revisited
- Dutch newspaper wipes out articles citing fabricated sources - Internet Archive to the rescue!
- Perdiep Ramesar in het Internet Archive
- Demise of the Dutch Blogosphere
- How to save a web page to the Internet Archive

Comments