
Mapping the Dutch web domain
Earlier this year I wrote a blog post about geo-locating web domains, and the subsequent analysis of the resulting data in QGIS. At the time, this work was meant as a proof of concept, and I had only tried it out on a small set of test data. We have now applied this methodology to the whole of the Dutch (.nl) web domain, and this follow-up post presents the results of this exercise.
Identification of Frisian sites in the .nl domain
Briefly after I wrote my earlier blog post on geo-locating web domains, my web archiving colleagues expressed an interest in applying the procedure to the Dutch top-level .nl domain in its entirety. The immediate occasion for this was an ongoing initiative to map and harvest the Frisian web domain. Friesland (Fryslân) is a province in the northern part the Netherlands. It has about 650 thousand inhabitants, over half of which speak West Frisian as their native language. In 2014 a dedicated Frisian .frl web domain was established, and in 2019 this domain spanned about 15,000 top-level domain sites, with mostly Frisian-language content1. As many Frisian web sites are still part of other top-level domains such as the “regular” .nl domain, the identification of such sites could provide valuable additional information about the Frisian web. The reasoning behind this is, that if an .nl domain is hosted somewhere in Friesland, chances are it corresponds to a web site that either uses the Frisian-language, or is related to Friesland in some other way. Since we already had access to a list of all .nl domains (provided to us by registry operator Stichting Internet Domeinregistratie Nederland), it seemed viable to extend the earlier geo-location exercise to the entire .nl top-level domain.
Geolocation of web domains
Geo-locating a web domain involves two steps2:
-
IP lookup: for each domain, we need to establish its corresponding IP address. There are various ways (and tools) to do this, but for the current analysis I used the Unix host tool.
-
Lookup geolocation data: in this step we look up the geolocation attributes (latitude, longitude, but also country and city names) from each identified IP address. Here I used the GeoIP2 Python module, with the GeoLite2 City database (freely available after registration). This database is widely used; for example, the British Library used it for geo-locating their 2014 domain crawl3.
Processing millions of domains in the era of COVID-19
I first tried to run the geolocation script that I also used in my earlier blog post, using the full list of 5.86 million .nl domains as an input file. I started the script on the 2nd of March on a local machine in my office at the KB, and by extrapolating the throughput after one day, I estimated it would need about 10 days to finish. Unfortunately, by that time the KB had closed down due to the COVID-19 outbreak, which meant I was unable to ever retrieve the results any time soon. I briefly considered to re-run the script from home, but decided against it for practical reasons4. Then some months later my colleague Kees Teszelszky (who initiated the activities on the Frisian web domain) suggested we might use the services of SURFsara, which hosts several cloud computing facilities that can be used free of charge by Dutch research institutions. After getting in touch with them, SURsara gave us access to its HPC Cloud platform. Here I created a simple virtual machine running Ubuntu Server, and then installed the dependencies needed by the geolocation script.
Parallelization
To improve the performance of the script itself, I also parallelized its IP lookup component (which would take up most of its running time). Tests on an early version of the parallelized script resulted in a nasty memory leak when run with the full domains list. Even though I was able to fix this (albeit in a rather ugly way), tests with the improved script still showed a slow increase of memory consumption over time. I was not sure how this increase would develop over the course of processing 5.86 million domains, so to be on the safe side I simply split the domains list into 6 smaller files of 1 million domains each, and then ran the script consecutively on all these files.
Geolocation results
The processing of all 6 files completed without problems in about 54 hours. The main result of this is a set of 6 comma-delimited text files, with the following fields:
- domain: name of the web domain
- hasValidIP: Boolean flag that indicates whether the domain could be mapped to an IP address
- countryIsoCode: country ISO code (if available)
- cityName: city name (if available)
- latitude / longitude: latitude and longitude in decimal degrees (if available)
- accuracyRadius: indicator of the accuracy of the reported latitude / longitude pair in kilometers (if available)
Note that this does not tell us yet in which province each web domain is hosted. However, it’s pretty easy to add this information, as I will show below.
Adding the province information
In order to establish the corresponding province of each domain, I used QGIS, an open-source geographical information system, and a freely available vector layer of Dutch province boundaries in Shapefile format. In this Shapefile each province is represented as a polygon 5. After opening the shapefile, I imported the first geolocation CSV file. I subsequently used the Join Attributes by Location … function to add, for each domain point location, the value of the corresponding Province field from the Shapefile (if available). I then exported the result to a new CSV file (see my earlier post for details). I repeated this for each of the 6 CSV files. Finally I combined the 6 resulting output CSV files into one single file.
After importing this file into QGIS again (which is slow) I was able to create the following visualization of all domain hosting locations in the immediate vicinity of the Netherlands:
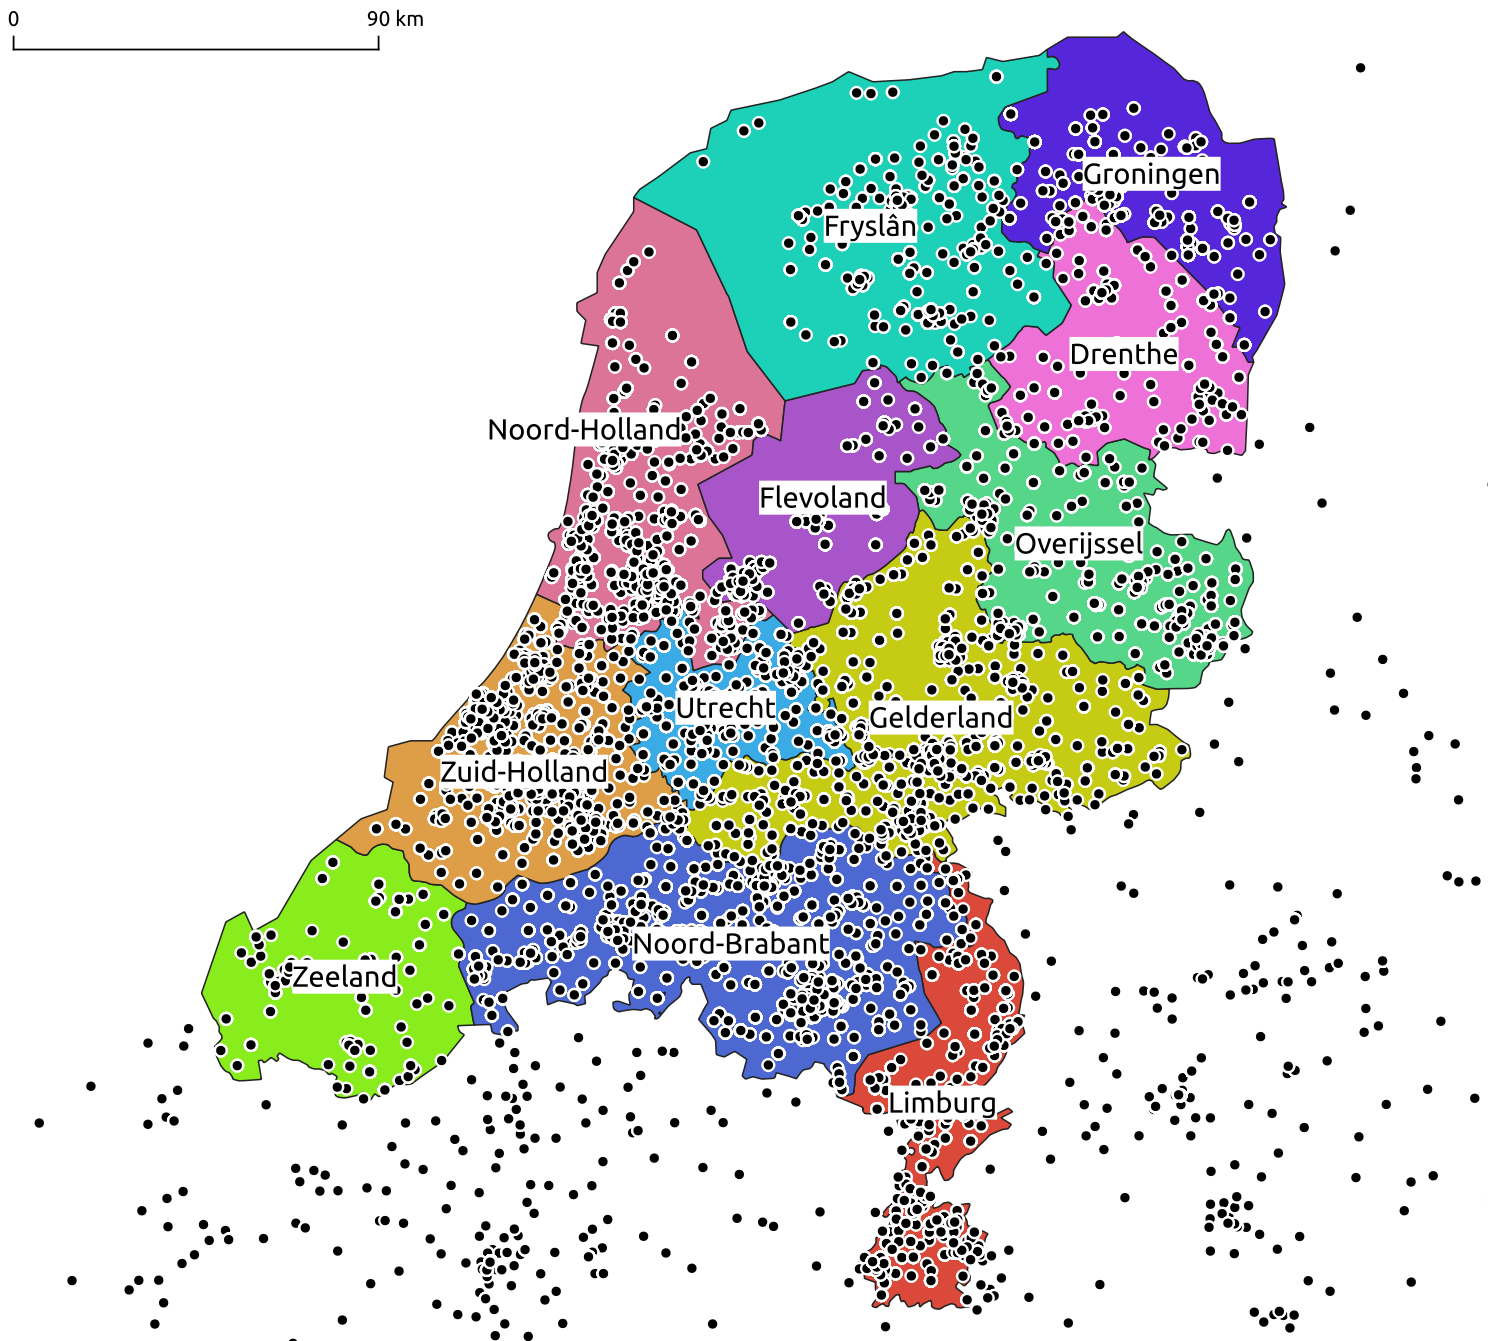
Note that one hosting location may represent many domains, so the number of visible dots does not reflect the actual number of domains. Also, I should perhaps stress here that these are all hosting locations (i.e. the location of the service provider that hosts a domain), not locations of individual domain owners!
Spatial distribution of the Dutch web domain
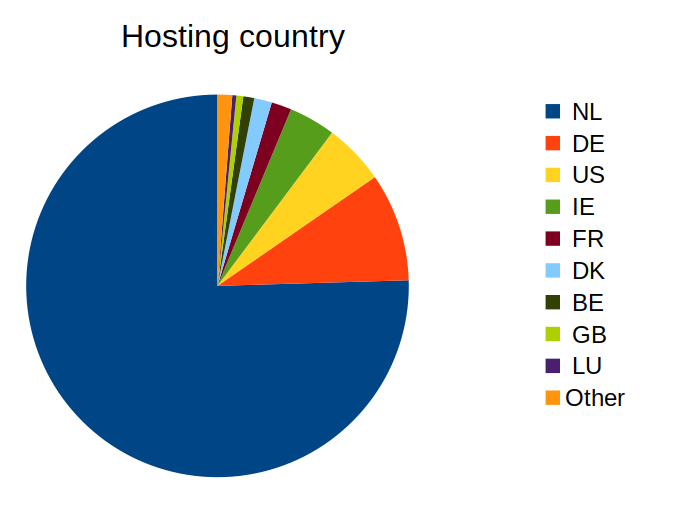
The results of this geolocation exercise give some interesting insights into the spatial distribution of the Dutch web domain. Below chart shows the distribution of hosting countries (based on the country ISO codes from the GeoLite2 database):
Here are the same data as a table:
| Country | Count | % of all active domains |
|---|---|---|
| NL | 3.45617e+06 | 75.03 |
| DE | 419623 | 9.11 |
| US | 235962 | 5.12 |
| IE | 180379 | 3.92 |
| FR | 78023 | 1.69 |
| DK | 68584 | 1.49 |
| BE | 42333 | 0.92 |
| GB | 26748 | 0.58 |
| LU | 15569 | 0.34 |
| Other | 56489 | 1.17 |
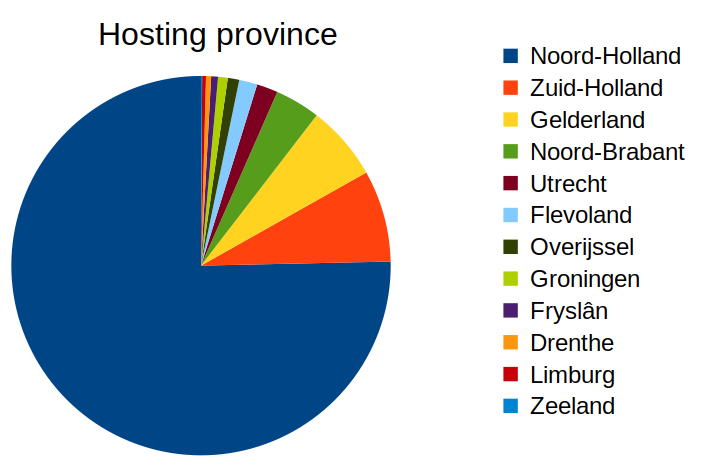
This shows that almost 25% of all active .nl domains are hosted from locations outside the Netherlands (Germany, United States and Ireland are the most popular hosting countries). Zooming in on the Netherlands only, the following chart shows the distribution of provinces from which domains are hosted:
And again in table form:
| Province | Count | % of all NL-hosted domains |
|---|---|---|
| Noord-Holland | 2.60368e+06 | 75.34 |
| Zuid-Holland | 270357 | 7.82 |
| Gelderland | 221120 | 6.4 |
| Noord-Brabant | 133056 | 3.85 |
| Utrecht | 62215 | 1.8 |
| Flevoland | 53595 | 1.55 |
| Overijssel | 33781 | 0.98 |
| Groningen | 28392 | 0.82 |
| Fryslân | 20184 | 0.58 |
| Drenthe | 14971 | 0.43 |
| Limburg | 11154 | 0.32 |
| Zeeland | 3325 | 0.1 |
It’s remarkable to see that over 75% of all NL-hosted domains are hosted from the province of Noord-Holland (North Holland) alone. This might simply reflect the concentration of internet hosting companies in especially the Amsterdam area. At only about 20 thousand domains, Friesland (Fryslân) is one of the “smallest” provinces in terms of this analysis.
Discussion
In this blog post I have outlined the geo-location and data processing procedure, and I have also shown how the results of this exercise can reveal spatial characteristics of a top-level web domain. However, it’s important to be aware of the limitations of the source data used here, as well as the methodology as such.
First of all there’s the accuracy of the geolocation results. The latitude and longitude values in the GeoLite2 database are only approximate, and refer to larger spatial entities, ranging from cities to even whole countries. As a measure of the approximate accuracy at any location, it reports an “accuracy radius” value, which is defined as:
The approximate accuracy radius, in kilometers, around the latitude and longitude for the geographical entity (country, subdivision, city or postal code) associated with the IP address.
The figure below shows the distribution of accuracy radius values for all active domains that are part of the .nl domain:
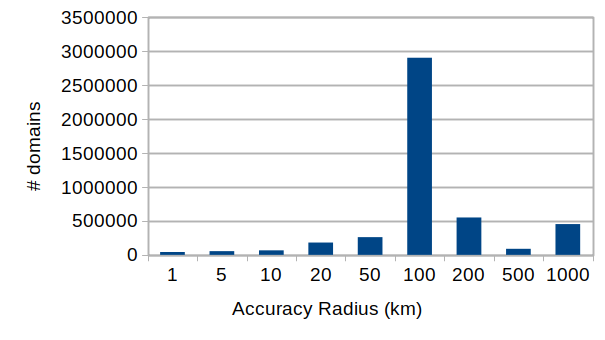
The underlying data show an accuracy radius value of 100 km or more for 96% of all active domains. If these values reflect the true accuracy of the database, the results of the current analysis should be interpreted with a good deal of caution, especially for a small country like the Netherlands. It might be able to get better results with MaxMind’s (the company behind the GeoLite2 database) higher-precision databases, which are available commercially.
Another thing to keep in mind, is that not all active domains have an associated web site. For example, some domains are only used for e-mail (I actually own such an email-only domain myself). For this analysis I haven’t investigated this any further.
Acknowledgements
Stichting Internet Domeinregistratie Nederland provided us the top-level .nl domain data on which this analysis is based. SURFsara (and in particular Nuno Ferreira) is thanked for allowing us to use their HPC Cloud computing facilities, and for their help in getting things running. Thanks are also due to Kees Teszelszky for his help with this work.
Further resources
-
Analysis script for QGIS-produced CSV file - This script automatically creates a report with most of the table data presented in this blog. It also exports the Frisian records to a subset.
-
See Kees Teszelszky - ‘Alle Begjin Is Swier’: The Use Of The Frisian Web Domain Web Data For Digital Humanities Research. ↩
-
See my earlier blog post for a more detailed discussion. ↩
-
Geo-location in the 2014 UK Domain Crawl: https://blogs.bl.uk/webarchive/2015/07/geo-location-in-the-2014-uk-domain-crawl.html ↩
-
Mostly related to network stability, and the fact that I needed the two machines I have available at home for other things that would most likely interfere with the geolocation procedure. ↩
-
According to its description, the provinces file is suitable for map scales ranging from 1:750,000 to 1:1,000,000, which suggests a (very approximate) spatial accuracy of about 1 km, which is adequate for this purpose. ↩
-
Note that some of the content of this blog post is outdated, because it is based on an older version of QGIS. For example, with the current (3.14) version I did not need to perform the (somewhat tedious) coordinate system transformation step. ↩
-
web-archiving
- How to preserve your personal Twitter archive
- Mapping the Dutch web domain
- Restoring Liesbet's Virtual Home, a digital treasure from the early Dutch web
- Web domain geolocation and spatial analysis with QGIS
- Crawling offline web content: the NL-menu case
- Resurrecting the first Dutch web index: NL-menu revisited
- Dutch newspaper wipes out articles citing fabricated sources - Internet Archive to the rescue!
- Perdiep Ramesar in het Internet Archive
- Demise of the Dutch Blogosphere
- How to save a web page to the Internet Archive

Comments